3 Key Metrics Everyone in Marketing Can Use That Tells You If Your SEO and Content Marketing Is Effective
3 Key Metrics Everyone in Marketing Can Use That Tells You If Your SEO and Content Marketing Is Effective
If you have google analytics installed on your website (which any successful website MUST have) then you can use the following three metrics to give you a black and white answer on if you had a successful SEO campaign/content marketing plan for your business or e-commerce website for the quarter. Keep in mind this is surface level data but it’s certainly imperative to look at in house on a regular basis and understand the implications on your business and day to day operations no matter the size of your organization in today’s competitive marketing environment.
- Google Organic Search Traffic Report. Organic search results are listings on search engine results pages that appear because of their relevance to the search terms, as opposed to their being advertisements. In contrast, non-organic search results may include pay per click This metric along with the others here can be access via Google Analytics or Google webmasters which all successful digital marketers utilize and mine data from. The key metric like most things is growth…If this traffic sourcehas grown vs prior quarter and vs prior quarter last year you are doing something right! We are often asked what acceptable growth is. The best answer is depending on the # of visitors per month a website gets. To clarify a very successful SEO campaign can jump organic traffic 5% for websites that get over 10,000 visitors per month. That is a healthy increase at 500 extra users per month. For websites that average closer to 200-600 visit per month closer to 10-20% is considered very good organic growth for Quarter VS Quarter.
- Social Media Traffic Report Traffic from social Media sites like Facebook, Twitter, Instagram, LinkedIn, Tumblr, or Other outlets you may post content to are a great indicator of your content marketing success. If this is growing it is a great sign that your content is being consumed and is relevant to your audience. If your social media traffic is down vs the prior quarter or down vs Q2 of 2016 then take a look at your old strategies and re align your content marketing plan. Where is it down? Facebook Twitter? Why is it down? Did you spend more ad dollars or is it because of less engagement due to less relevant and likeable content vs prior periods? The beauty of looking at the data allows you to make informed decisions on your content marketing strategy and how it can enhance you SEO with the correct Implementation.
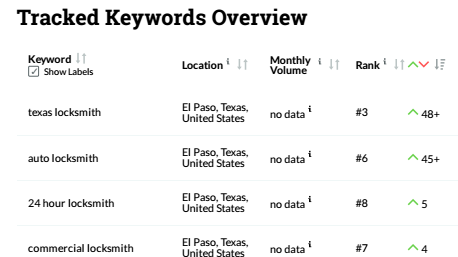
- Keyword Tracking Report This is an important metric to look at because it can depict where you stand in the organic search results for your most competitive/valuable keywords that you are targeting for your industry. This allows you to track movement and your success (or failures) on your overall on-page and Off-page SEO and allows you to adjust accordingly. Ideally your provider tracks and provides reporting on a monthly and sometimes weekly basis. If not, you can always track keywords yourself with a free tool like https://www.rankscanner.com/ to help hold your provider accountable.

These 3 metrics are easy to produce/learn and once you grasp them it will give you a surface level understanding of if you’re SEO/content marketing strategy is heading in the right direction. In Internet Marketing It’s always good to compare multiple numbers and pick up on any trends. YTD vs Prior Year, MTD vs Prior Year, Quarter Vs Prior Year, Quarter Vs Prior Quarter, ETC ETC are always good numbers to compare on a regular basis with your SEO/SEM internet marketing provider.
Are you looking to switch internet marketing providers? Take advantage of our specials in February! We have aggressive monthly internet marketing programs on Sale until September 1st starting at just $1,000.00/Month and Includes Call Tracking/Recording to track your ROI, Google Analytics Reports, SEO, and more! Email us today caleb@mktg4thefuture.com to learn more.

